DeepView
Interactive Profiling Meets Predictions.
Interactive performance profiling and debugging tool for
PyTorch neural networks.

Visually identify
runtime bottlenecks at both model and source code level
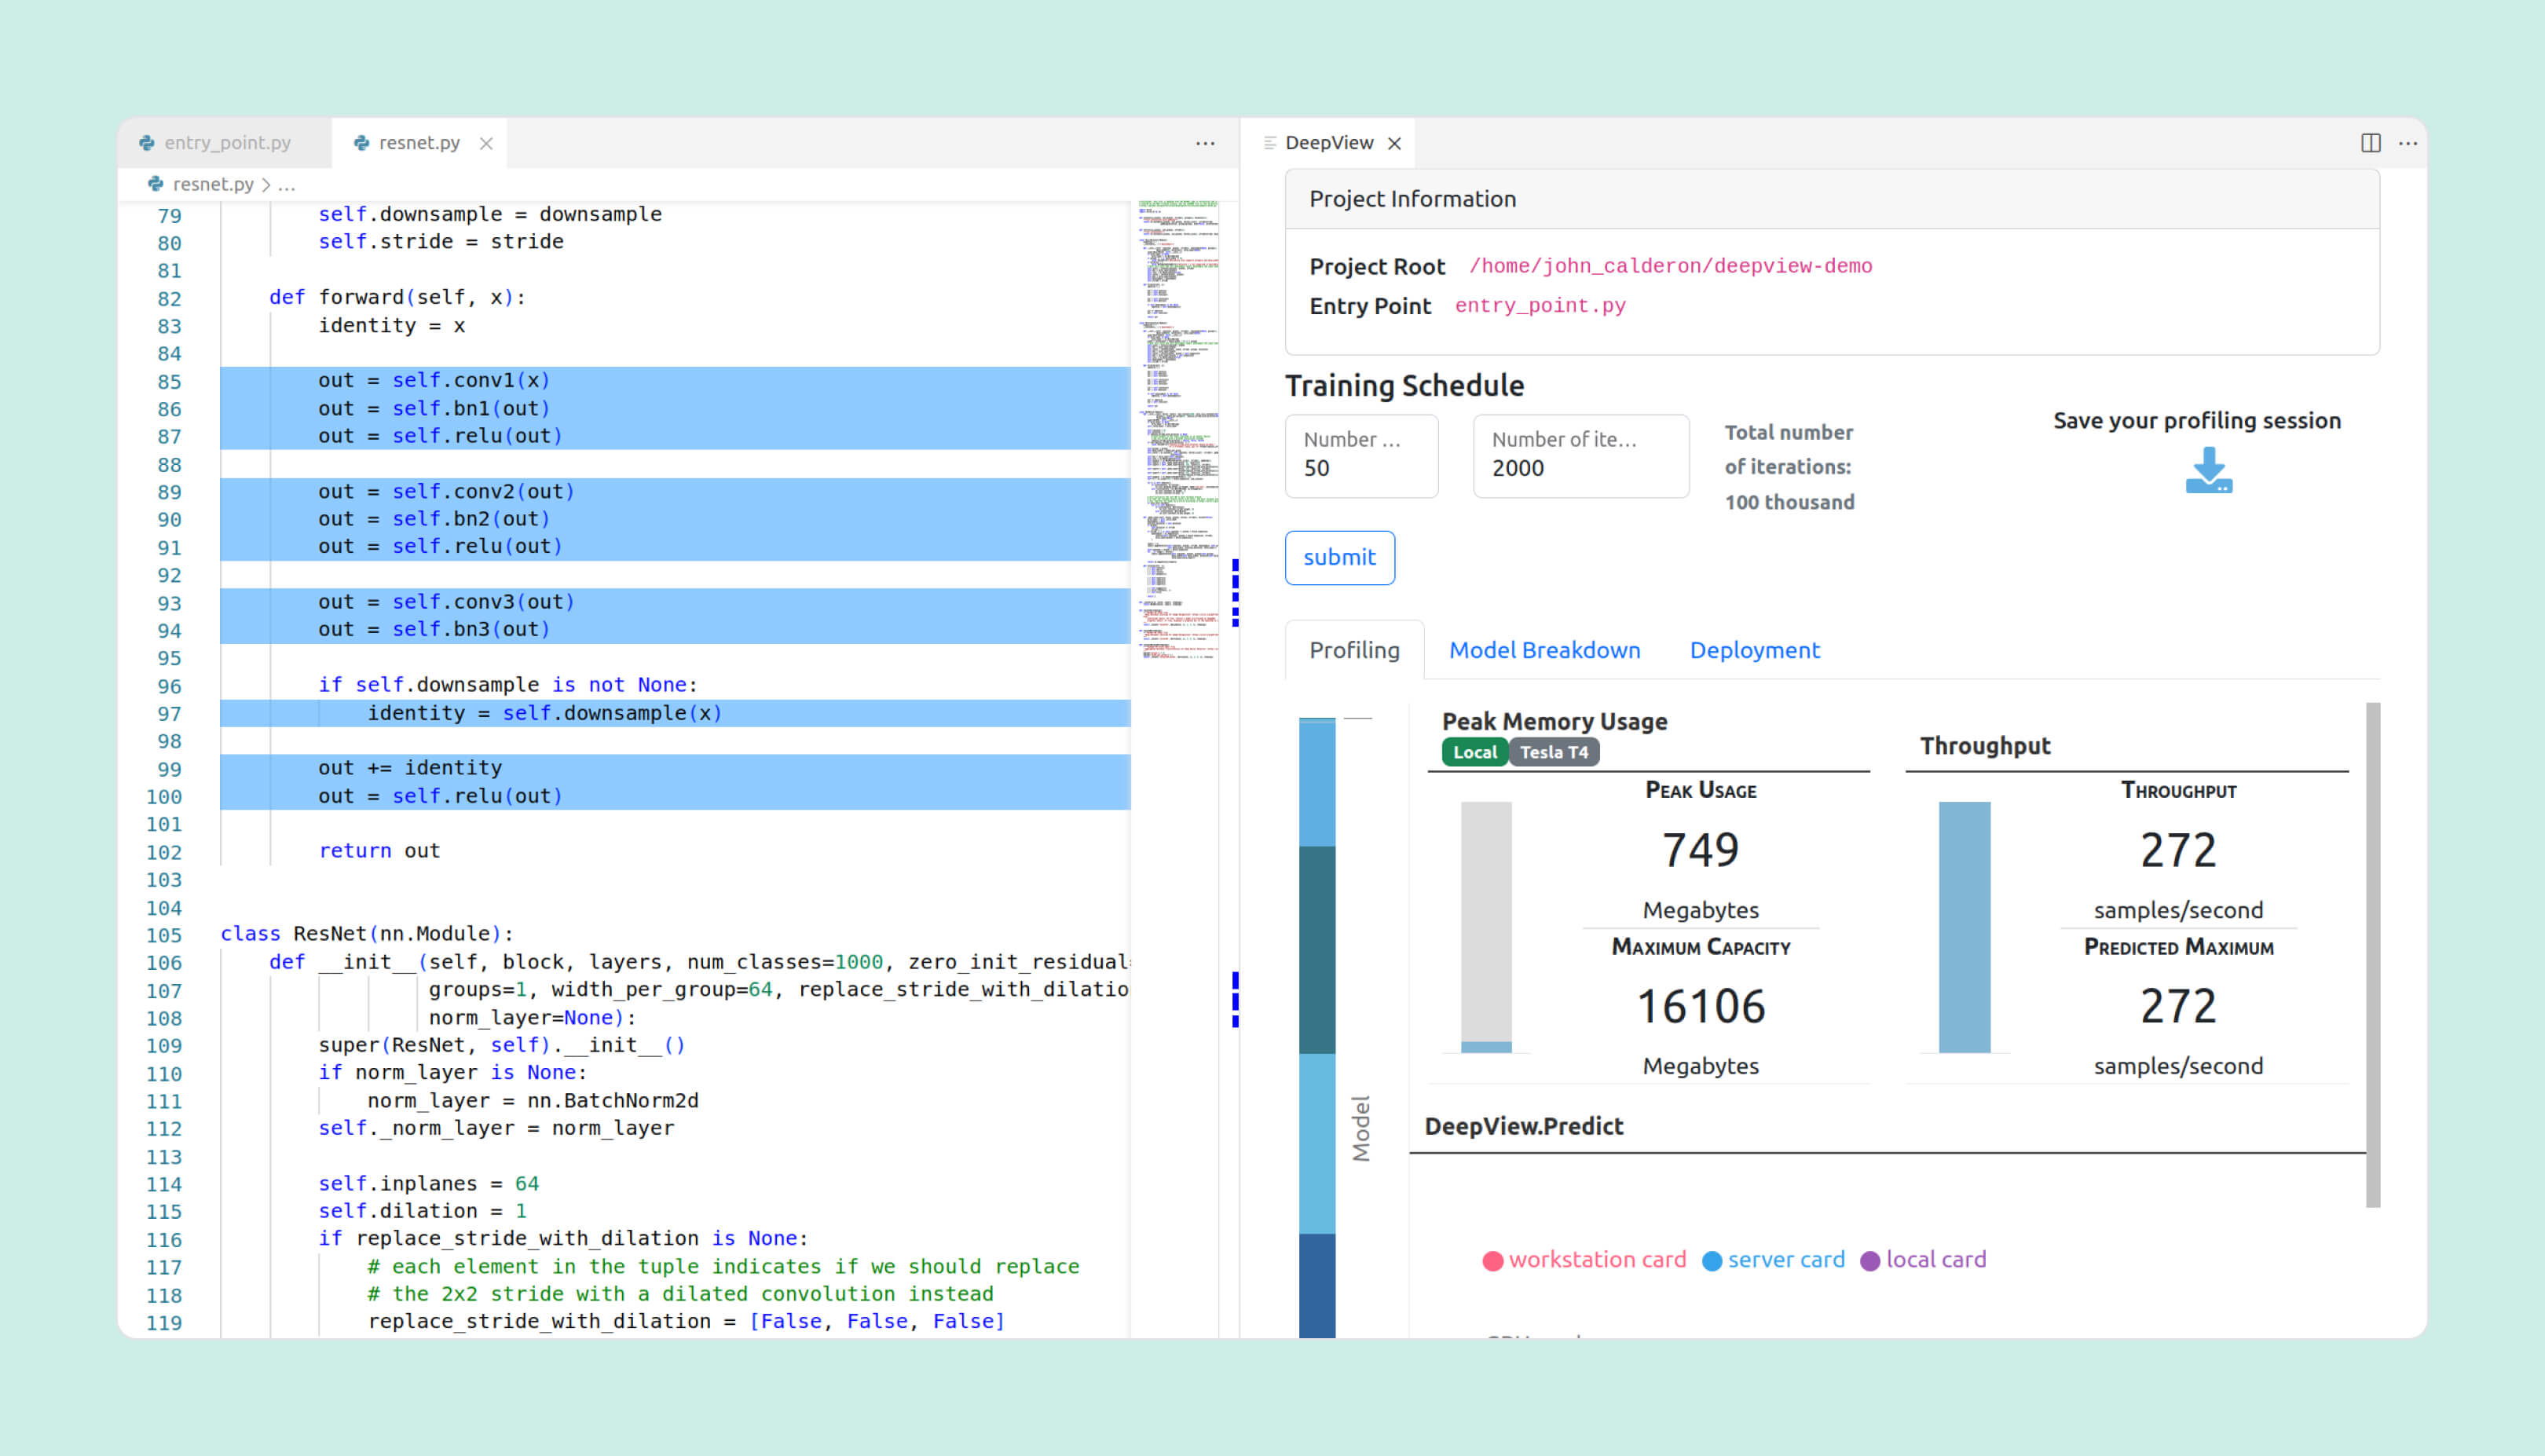
Optimize batch size to
maximize memory utilization & increase training throughout
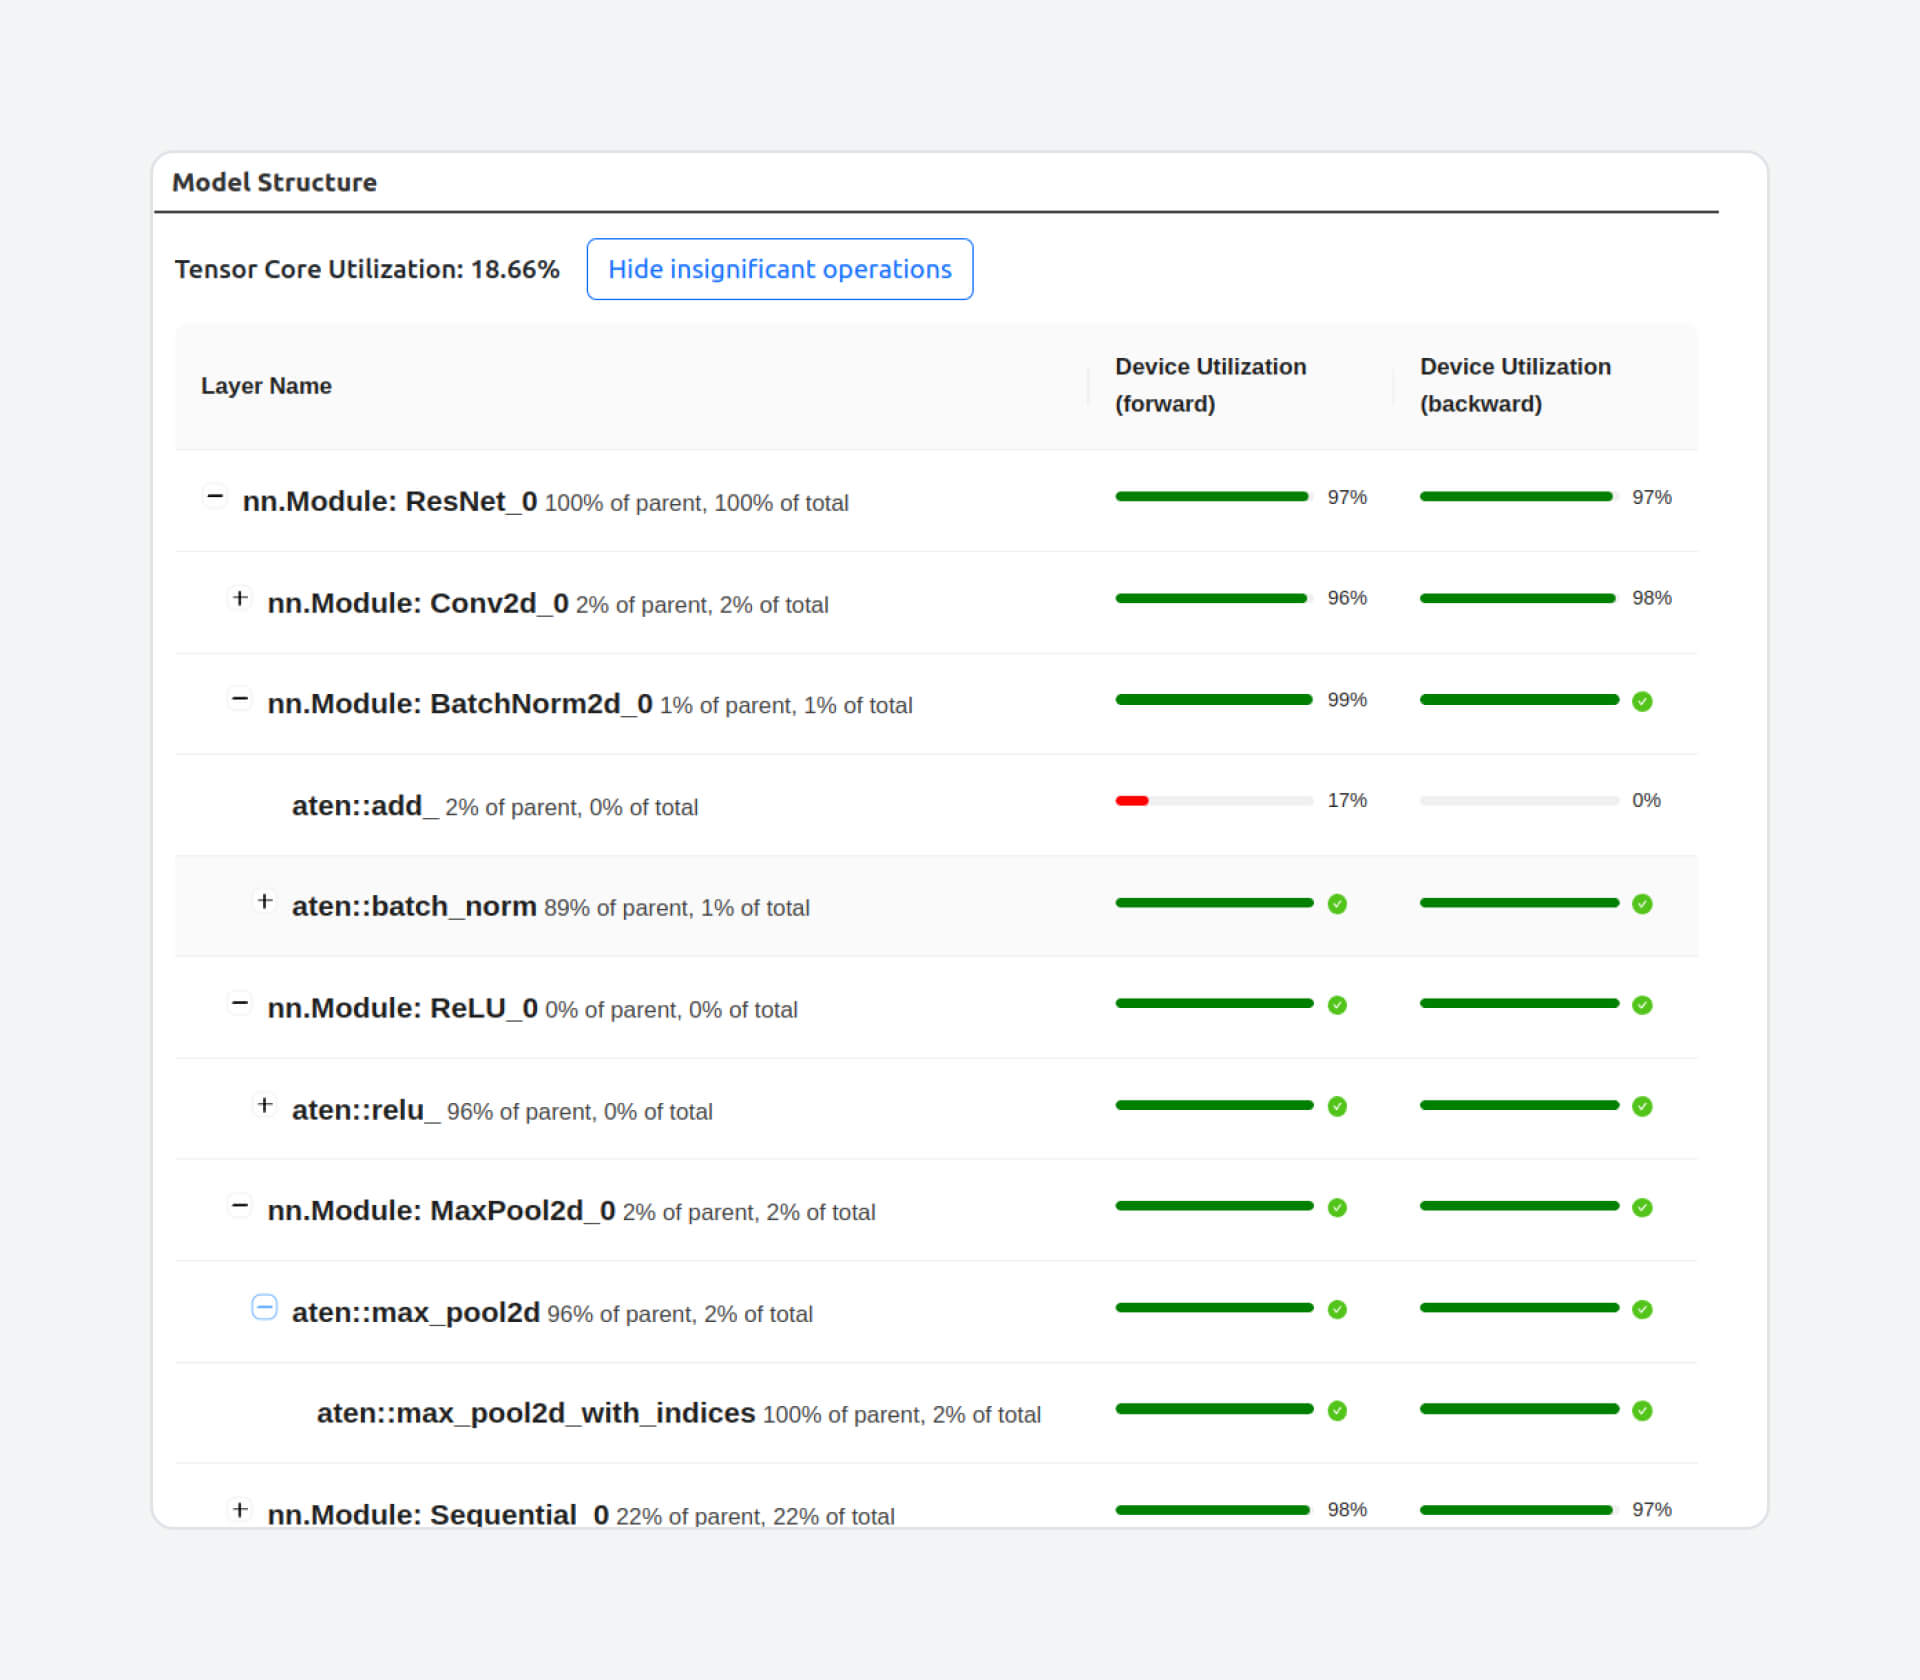
Attain insights from GPU utilization at a layer granularity
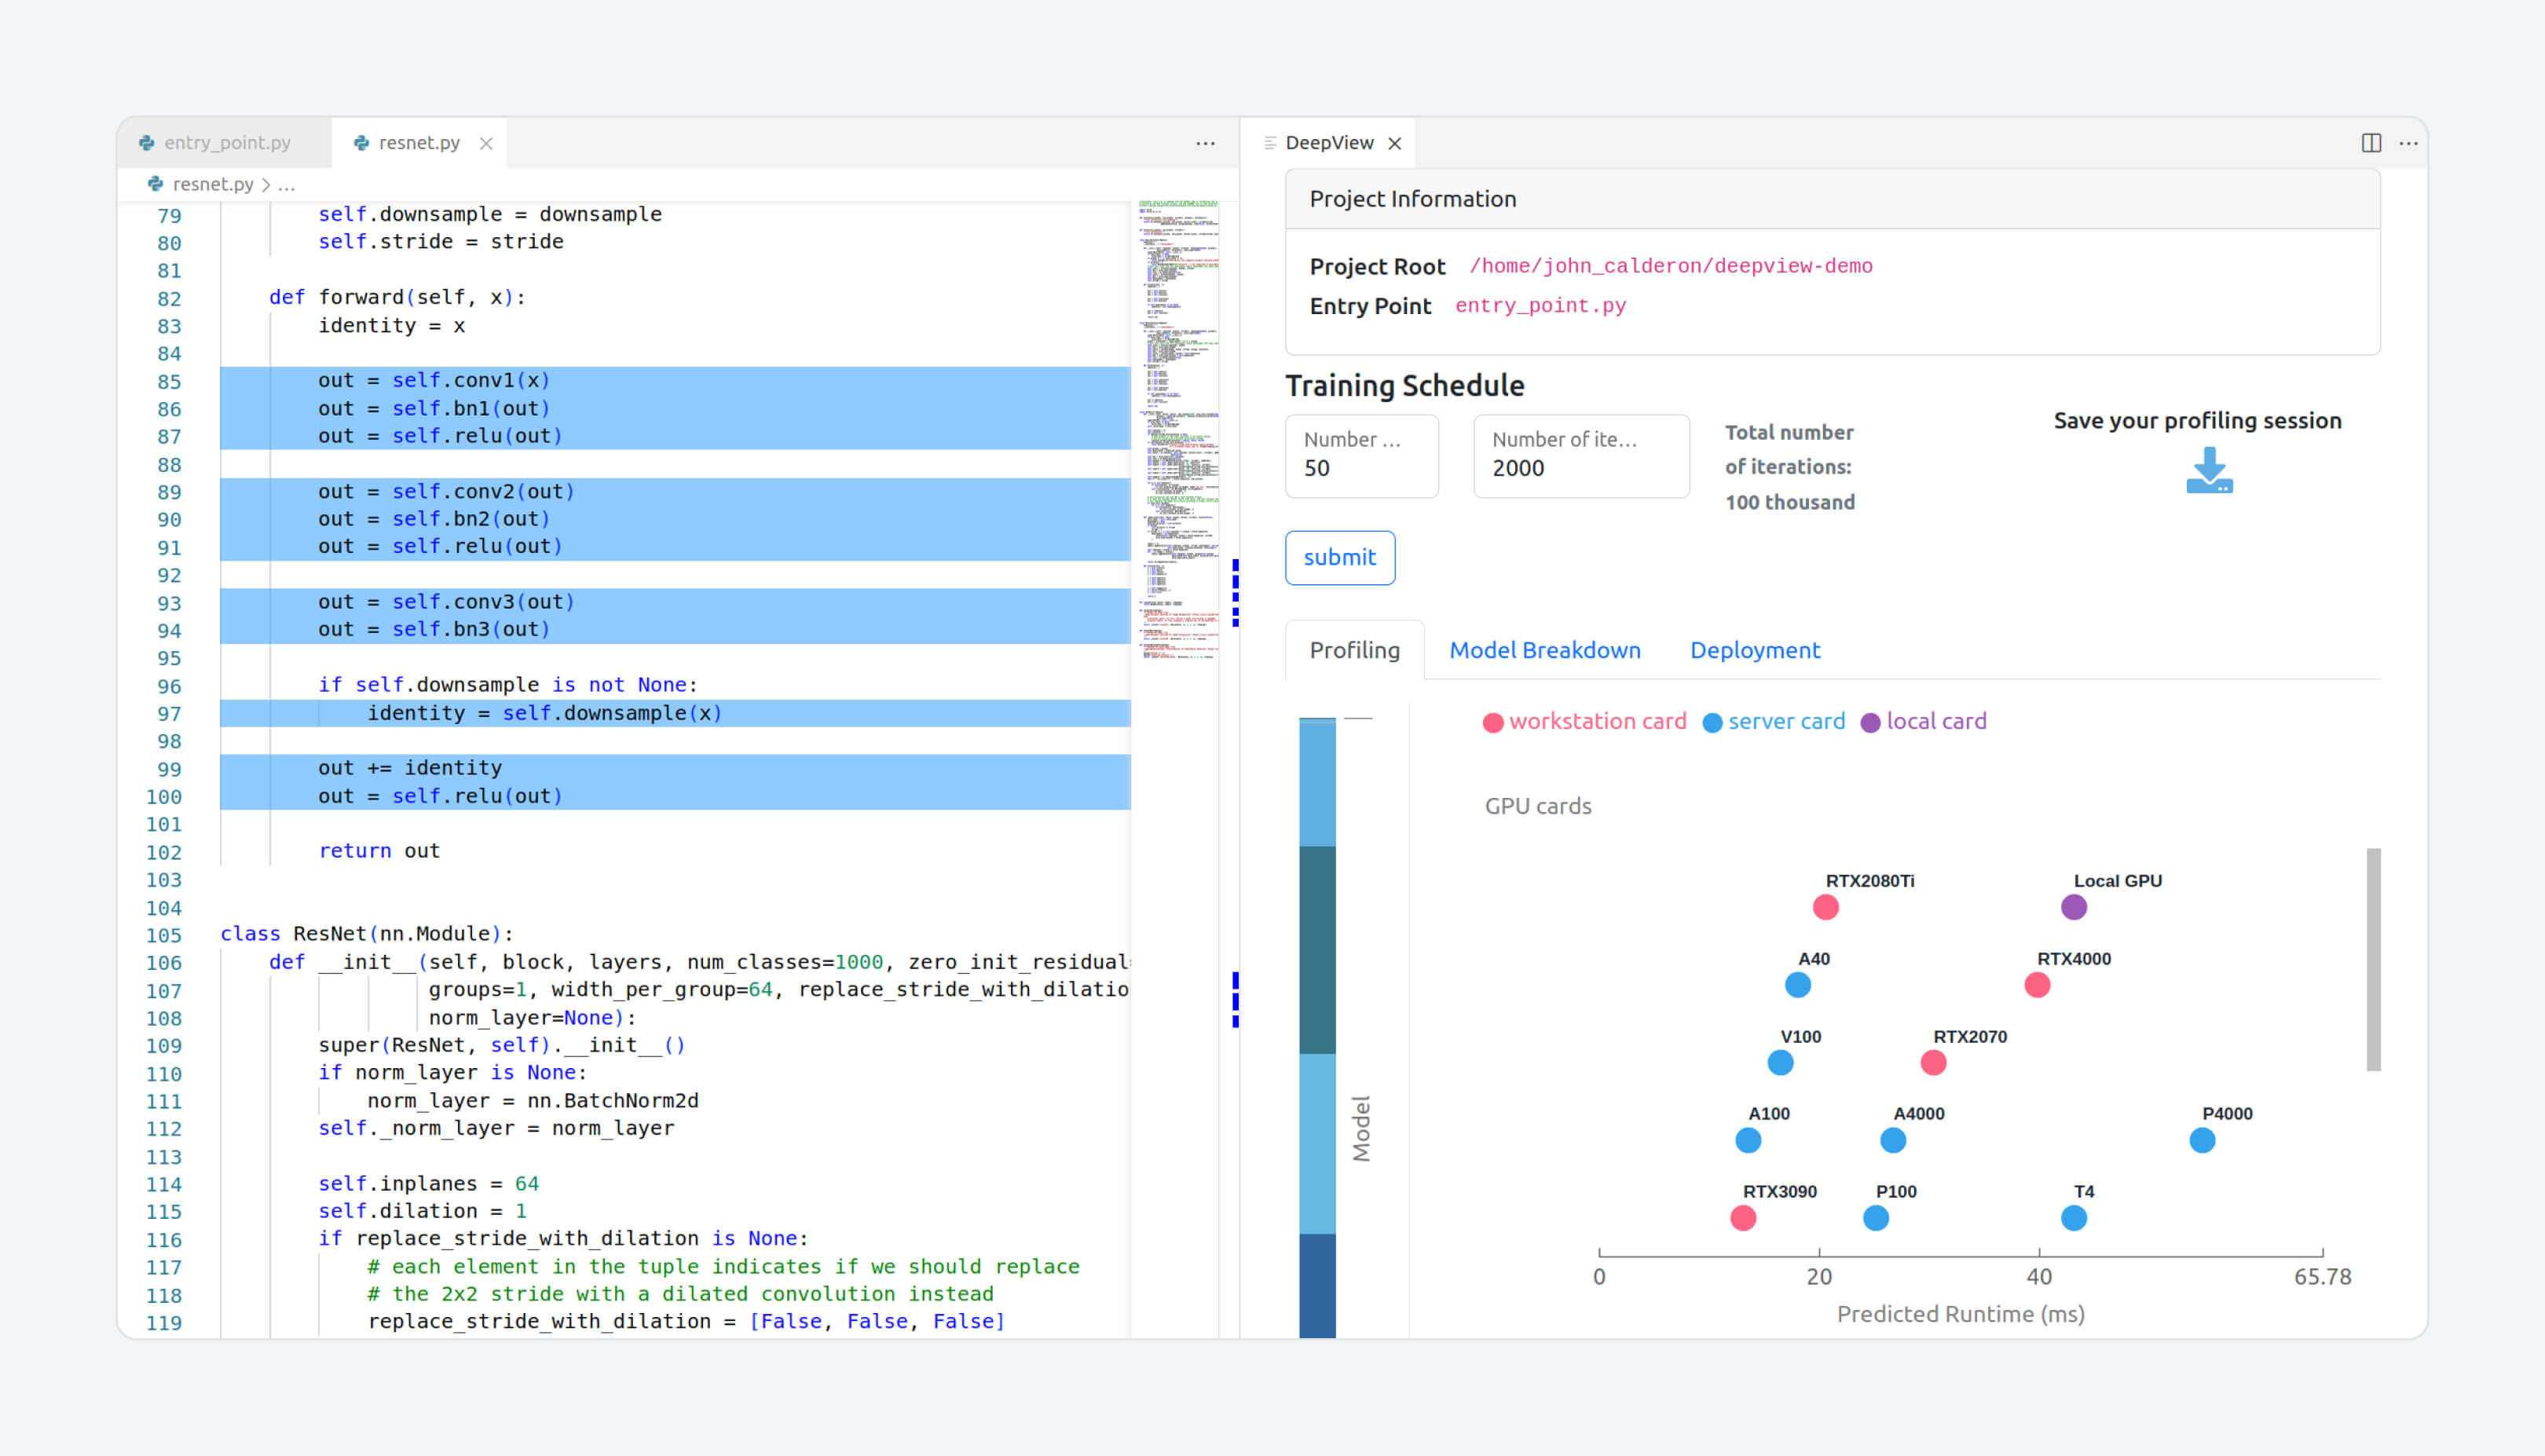
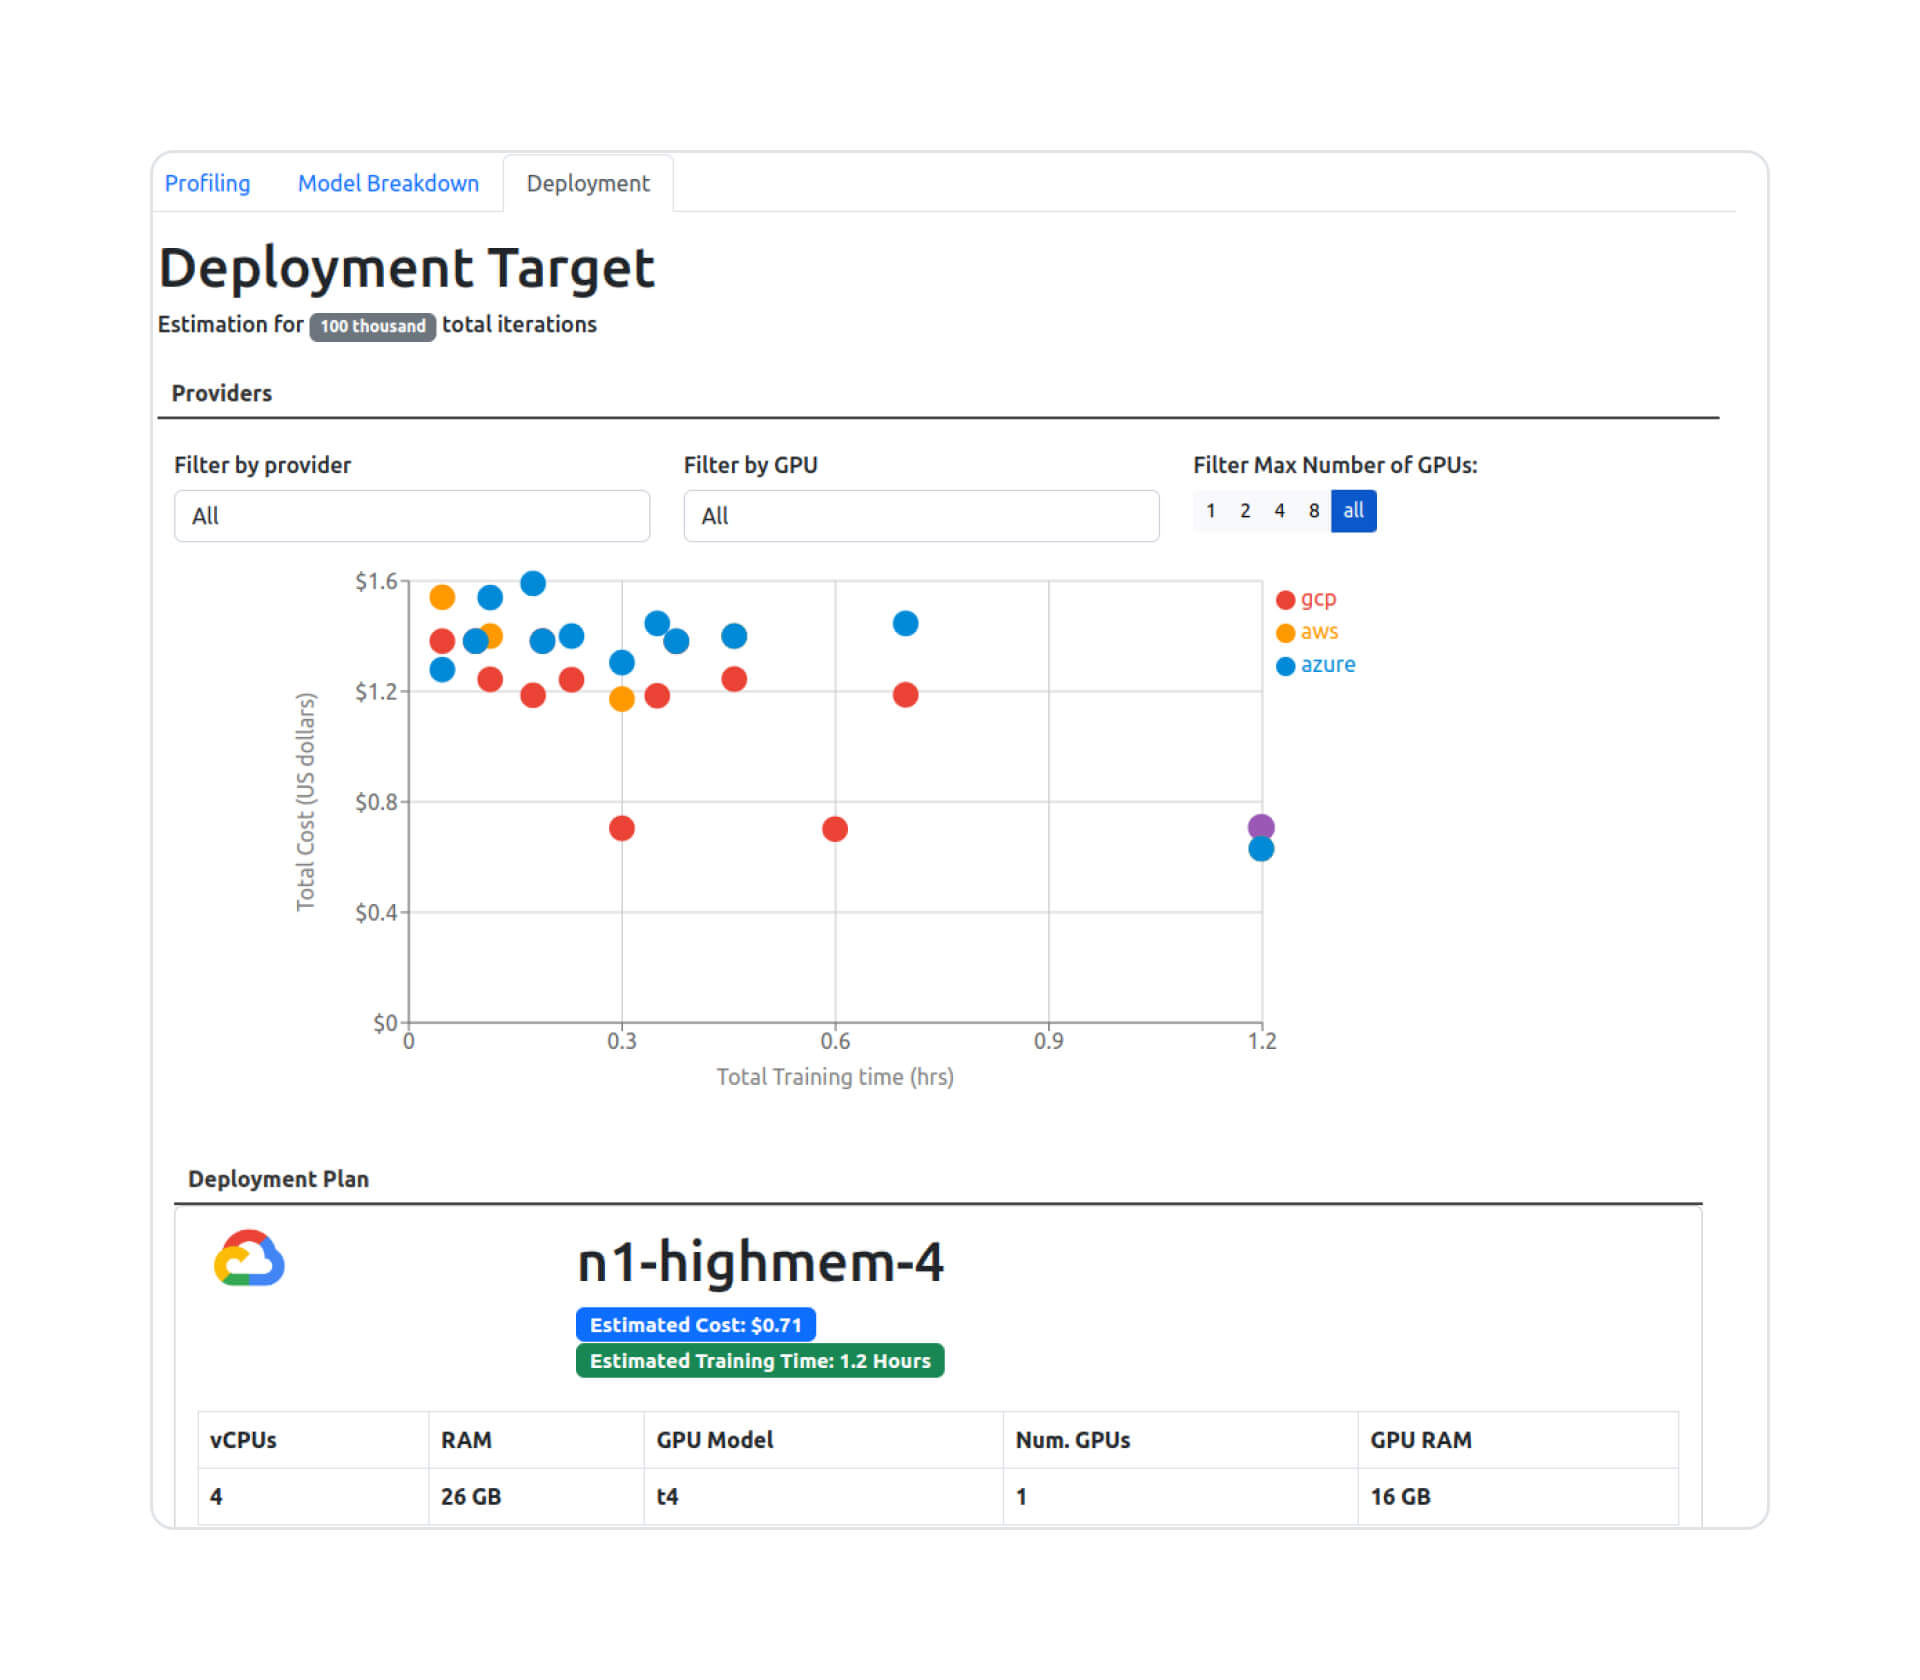
Estimate your training cost and time using different cloud platforms like AWS, Azure and GCP
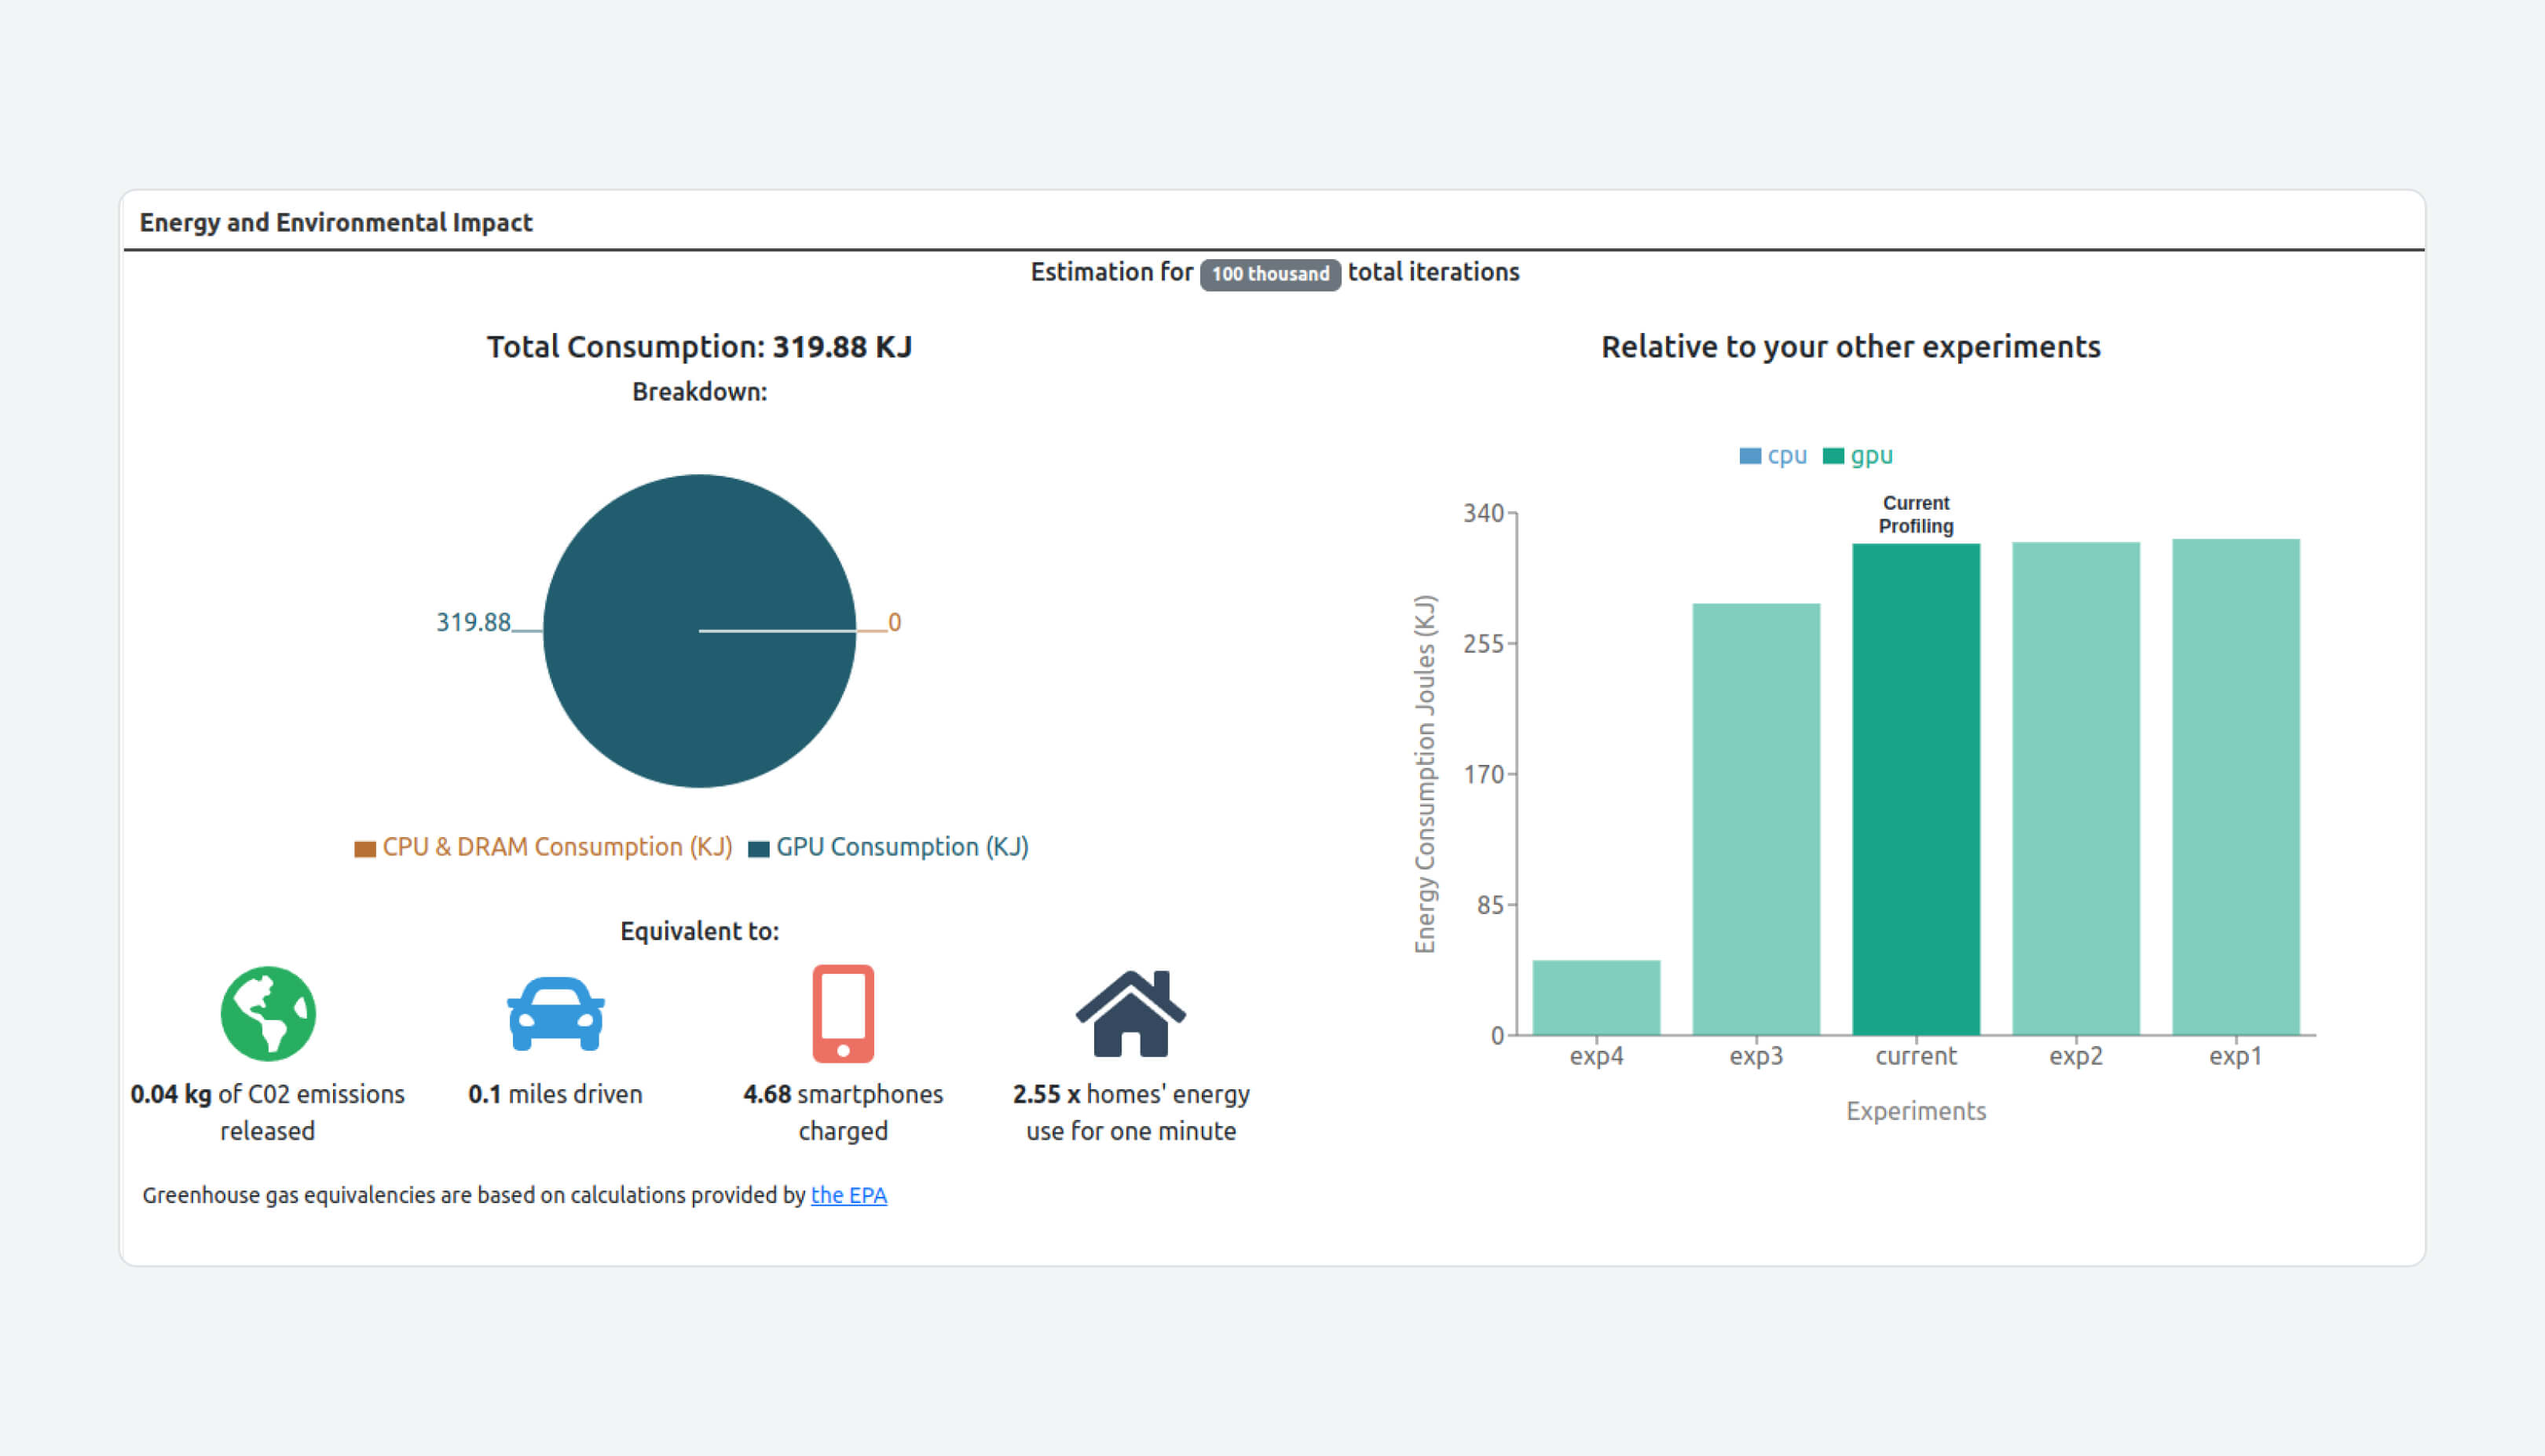
Track energy consumption and environmental impacts